This article is from Dollars & Sense: Real World Economics, available at http://www.dollarsandsense.org

This article is from the
March/April 2023 issue.
Subscribe Now
at a 30% discount.

The Inflation Reality and the Attack on Wages
Inflation was slow throughout the second half of 2022. Yet you wouldn’t know this from newspaper headlines, statements from “experts,” or the statements and actions of the Federal Reserve. It was only in January of 2023, when the Consumer Price Index (CPI) for December 2022 was released showing an actual (very small) decline in prices for the month, that there began to be a general recognition that the relatively high rate of inflation of late 2021 and the first half of 2022 had abated. The December 2022 decline of one-tenth of 1% was later revised upward to an increase of one-tenth of 1%, but this tiny increase still brought attention to the easing of inflation. (See the sidebar on the different ways inflation is measured, next page.)
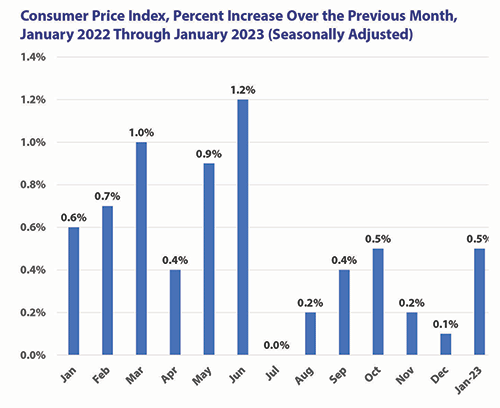
Take a look at the figure below showing the increases in prices month-to-month in 2022 and into January 2023. Just to be clear, the figure shows, for example, that prices in March were 1.0% higher than in February, and prices in November were 0.2% higher than in October. The average month-to-month increase of the CPI in January through June of 2022 was 0.8%. If the second half of the year had been the same as the first, the increase in prices for the whole year would have been up 10%. However, the average month-to-month increase of the CPI in the second half of the year was just 0.23%. If the whole year had been the same as in the second half, the increase for the year would have been 2.8%.

As the figure also shows, in January 2023, prices rose 0.5% over December, a rate that is high in the in the context of the half year from July to December of 2022, but quite low compared to the first half of 2022. No one-month change by itself should be endowed with much significance, and when the January figure is taken into account to determine what has been happening since mid-2022, it doesn’t make much difference. If the average rate for July 2022 through January 2023 were maintained for 12 months, the rate of inflation for those 12 months would be 3.3%, only one-third of the rate for the first half of 2022. (At the time of this writing, January 2023 is the most recent month for which data are available.)
The Headlines
But what about the headlines in the fall? For example, in mid-October, when the price data for September were released, the New York Times headline stated, “Inflation is Unrelenting,” and the sub-headline proclaimed, “Inflation Rose Quickly in September.” Yet, as can be seen in the figure, inflation had been relenting since July. Yes, September (and October) had seen some rise in prices, but nowhere near as much as in most months in the first half of the year.
The problem is that the Times—and other media—was not looking at what happened in September, in spite of what it said in the article, but at the change from September 2021 to September 2022. This way of understanding price increases may have its uses, but it can be very misleading, especially when there are sharp changes in inflation from one month to the next. Suppose, for example, that the CPI in all months of 2021 had been 100, but then jumped up to 110 in January 2022 and stayed there, with no further increases (or decreases) throughout the year. This year-at-a-time way of describing inflation would then report inflation in January as 10%, but also report inflation as 10% in February and every month through December of the year. Even if prices dropped one or two percentage points in one of those later months, it would still appear as though inflation was going strong, with the price level in that later month reported as 9% or 8% above what it had been for that month in the previous year.
Measuring Inflation
The Consumer Price Index (CPI) is the most commonly used measure of price changes. It is created by taking the prices of many, many goods and adding them together based on the percentage of consumers’ purchases accounted for by each; that is, a “weighted average” price level is calculated, where the weights are the percentage shares of total purchases. This is done for a “base” year, and the price level for that year is then set at 100. The index for each subsequent year is reported relative to that 100.
For example, take the case where the only two items purchased are bread and milk, with the former accounting for 60% of expenditures and the latter 40% of expenditures. The price of bread is $1.00 and the price of milk is $2.00. Then the price level for this base year is $1.40 ($1x.60 + $2x.40). This price level is set at 100 to create the index. Suppose, then, that in year two, the price of bread is unchanged but the price of milk rises to $2.50; nonetheless, still 60% of expenditures are on bread and 40% on milk. Then the price level in this second year is $1.60 ($1x.60 + $2.50x.40). The increase from the first year is 14.3. The index for the second year is then 114.3. When the CPI is calculated for each month, it is “seasonally adjusted” to eliminate the effect of seasonal and calendar (e.g., Christmas) influences. The seasonally adjusted figure is used in this article.
The Federal Reserve, however, uses the Personal Consumption Price Index (PCE), which has some technical differences from the CPI. The two indexes provide quite similar pictures of what has been happening to prices over the past year and months, though during the last several years the CPI has increased a bit more than the PCE.
With both the CPI and PCE, policy-makers tend to be especially concerned with the “Core” measure, which excludes energy and food prices. Energy and food prices tend to be more volatile than most other prices, and show sharp changes that are sometimes not directly connected to the overall state of the economy. The Core CPI and the Core PCE, then, exclude sharp changes that are not characteristic of prices in general, but are the result of events shaping energy or food prices or both. In the second half of 2022, the CPI rose 1.4% and the PCE rose by 1.0%, while the Core CPI rose 1.9% and the Core PCE rose 1.7%.
The Effort to Push Wages Down
Both the year-at-a-time and the month-to-month figures are readily available from government agencies. There is no good reason to focus on the former and ignore the latter. Perhaps in an era without sharp changes in inflation, journalist and others got in the habit of using the year-at-a-time figures, but that’s no excuse for journalists, economists, and Fed officials.
The impact of giving little attention to the month-to-month figures, moreover, has been quite bad. The year-at-a-time focus created the specter of a continuing high rate of inflation. Consequently, there has been limited opposition to the Fed’s effort to lower wages. Lowering wages is what the Fed is trying to do, with support from many economists, politicians, and business officials. Higher interest rates will, Fed leaders hope, curtail business activity and lead to layoffs. The resulting rise of unemployment will weaken workers’ bargaining power, and real wages (the buying power of wages) will decline. The result is supposed to reduce inflation.
This was clearly stated by the chair of the Fed, Jerome Powell, in his December 14, 2022, press conference. Repeatedly, he referred to “high wages” and defined progress “in terms of average hourly earnings coming down.” And: “…we will be looking for wages moving, you know, down to more normal levels.” (What Powell meant was that the Fed wanted to keep wages from rising along with inflation; the result would be a decline in real wages.)
All this was needed, according to the standard argument, to halt inflation. This “standard argument” is simple— indeed, it’s simplistic. Pushing up interest rates, which is what the Fed is trying to do, will tend to reduce both consumer and business demand. Businesses will then lay off workers; the resulting higher unemployment will tend to weaken workers’ bargaining power, leading to lower wages. Lower wages will lower consumer demand and combine with the impact of higher interest rates to push prices down—or at least curtail price increases. In this argument, the main culprit pushing up prices is rising wages, which employers respond to by raising prices of their products. And lower wages, in addition to reducing demand, will take the pressure off employers to raise prices.
A False Argument
But there are several problems with this argument:
- Wages were not rising as fast as prices. During 2022, while consumer prices rose 6.8%, average hourly earnings of all private-sector employees rose by 4.6%. In 2021, as the rapid inflation emerged, prices rose by 5.5%, and hourly wages rose by 4.9%. (Weekly earnings rose by only 3.1% in 2022 and by 5.2% in 2021, as employees’ working hours declined in 2022 but rose in 2021.) It’s hard to argue that wages are pushing up prices when prices are rising faster than wages.
- Although the Fed claims to be fighting inflation by reducing demand (through pushing up interest rates), there is considerable evidence that the inflation has not been caused primarily by excessive demand. An important report from the Roosevelt Institute, authored by Joseph E. Stiglitz and Ira Regmi, concludes: “Today’s inflation comes mostly from sectoral supply-side disruptions, largely the result of the Covid-19 pandemic and its consequent disturbances to supply chains; and disruptions to energy and food markets originating from Russia’s invasion of Ukraine. Demand patterns too have undergone significant changes, again largely induced by the pandemic. In some sectors, these effects have been amplified as a result of the exercise of market power. But today’s inflation, for the most part, is not the result of significant excesses of aggregate demand such as might have arisen from excessive U.S. pandemic spending.”
- The argument gives no attention to profits. Between the fourth quarter of 2019, just before the Covid-19 pandemic hit, and the second quarter of 2022, after-tax corporate profits rose from $2.1 trillion to $3.04 trillion, roughly a 45% increase. In this same period, prices increased by about 14%. Unlike wages, which lagged behind price increases, corporate profits outstripped and led price increases. This reality, associated with the lack of meaningful price competition in many markets, suggests that firms were able to use the unusual conditions of the pandemic to raise prices well beyond costs.
- The idea that inflation is a result of wages being too high and the cure for inflation is lowering wages suggests that we can only have an economy without inflation if we accept the highly unequal distribution of income that now exists—a proposition for which there seems to be no empirical evidence.
Inflation may continue to stay low in the coming months, as it did in the second half of 2022. If so, it will not be a result of the Fed’s actions to cut demand, raise unemployment, and lower real wages. Instead, if inflation does continue to lessen, it will more likely be because supply-side disruptions have abated. Yet, the Fed’s actions may succeed in pushing down wages, exacerbating rising economic inequality.
At the very least, its actions will make those inequalities harder to overcome.
Did you find this article useful? Please consider supporting our work by donating or subscribing.
