This article is from Dollars & Sense: Real World Economics, available at http://www.dollarsandsense.org

This article is from the
July/August 2023 issue.
Subscribe Now
at a 30% discount.

Death and Inequality
The high degree of economic inequality in the United States is bad enough. Worse yet, however, are the many other social ills that are associated with the great U.S. disparities in wealth and income—violent crime, environmental degradation, children’s poor school performance, and mental illness, to name a few examples. And perhaps most important is life expectancy, a prime measure of a society’s well-being.
Rising Life Expectancy, But...
In the second half of the 20th century and on into this first quarter of the 21st century, life expectancy (that is, life expectancy at birth) in the United States, as in most of the rest of the world, has been rising. However, according to a 2020 U.S. Census Bureau publication, a good part of the rest of the world has done better by this measure of rising life expectancy than has the United States. In 1960, when life expectancy in the United States was 70.1 years, it was higher in 19 other countries—not by much, as 73.5 years was the figure for those countries at the top of the list; tied for first place in 1960 were Iceland, Sweden, Norway, and the Netherlands. By 2015, however, while life expectancy in the United States had risen to 78.9 years, this country had dropped behind 39 others; Japan was number one at 83.3 years.
The comparison among countries is interesting for a set of reasons. The United States:
- has a higher per capita income than virtually all the countries with higher life expectancies;
- spends a much higher share of its national income on health care than the other countries (60% more per capita than any
- other high-income country, and two-and-a-half times as much per capita as Japan); and
- has a considerably more unequal distribution of income than these other countries.
Of the 21 countries (for which data are available) with per capita income over $40,000 and a population of over 5 million, the United States stands out in recent years as having the greatest degree of income inequality (measured by the World Bank’s Gini coefficients) and the lowest life expectancy (by data from the Population Reference Bureau). Indeed, with regard to life expectancy, while the U.S. figure is 76 years, 19 of the countries are 80 years or higher; only the Czech Republic is close to the United States, at 77 years. With regard to the Gini coefficient, only Israel comes close to the United States.
The Decline in Life Expectancy
More recently, but before the coronavirus pandemic, life expectancy in the United States actually declined, falling (very slightly) from 78.84 years in 2014 to 78.54 in 2017; by 2019, the figure had risen to 78.79, virtually back to its 2014 level. Then, over the first two years of the pandemic, life expectancy plummeted to 76.4 years in 2021.
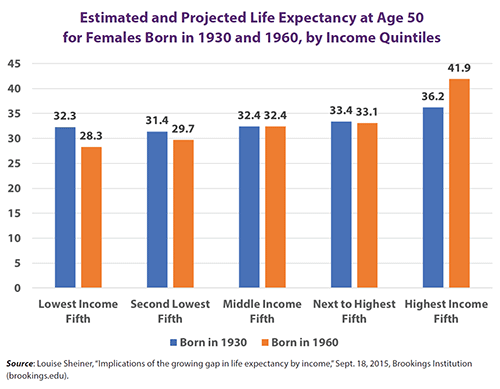
However, data like these, for the population as a whole, can be misleading. Consider the figure below, showing life expectancy for females by income fifths—that is, for each one-fifth of the population divided by income groups. The data show that for females born in 1930, when they were 50 years old, those in the highest income fifth of the population had a life expectancy of 36.2 years, and women in the lowest income fifth had a life expectancy of 32.3 years—a 3.9-year difference. But for women born in 1960, that difference had risen to 13.6 years. (For males, who generally do not live as long as females, the pattern is similar but not as great. The gap between the highest income group and the lowest income group increased by 12.7 years between males born in 1930 and those born in 1960. Also, life expectancy did not decline for males in any but the lowest income category.)

During the Pandemic
Data on the income of people who have died of Covid-19 are limited. However, the Poor People’s Campaign, in collaboration with the United Nation’s Sustainable Development Solutions Network, using county data, has studied “the disproportionate effects of Covid-19 on poor communities in the United States by connecting data about Covid-19 deaths at the county level with other demographic characteristics,” according to the report’s introduction. Among the results of their 2022 report are the following:
In 363 counties (top 10%) with the highest death rates, the population is 56% white, 21% Hispanic, 16% Black, 4% Indigenous, and 1% Asian, which is significantly less white, less Asian, more Black, and more Indigenous than counties with lower death rates. (Hispanic percentages did not change significantly). These counties have a poverty rate of 45%, which is one-and-a-half times higher than in counties with lower death rates.
Counties that have disproportionately more Black residents (defined here as more than 13.4%) had a significantly higher Covid-19 death rate than counties that did not. Collectively, the group of counties with larger Black communities experienced 32 more deaths per 100,000 than counties that were not predominantly Black.
[P]overty was not tangential to the pandemic, but deeply embedded in its geography. After [the pandemic’s] first wave, Covid-19 became largely ‘a poor people’s pandemic,’ with poor communities grieving nearly two times the losses of richer communities.
The Death-Inequality Connection?
Although there is a clear association between life expectancy—or, to put it bluntly, the frequency of death—and economic inequality, there is a dispute as to whether it is economic inequality or low income that causes lower life expectancy rates.
Two important books published in the early 2000s made the case that economic inequality plays a major causal role in affecting health and death rates: The Health of Nations: Why Inequality is Harmful to Your Health by Ichiro Kawachi and Bruce P. Kennedy (2002) and The Spirit Level: Why Greater Equality Makes Societies Stronger by Richard Wilkinson and Kate Pickett (2009). Among the several inequality-related factors that they see leading to poor health are increased stress and reduced social solidarity.
The arguments of these authors have been challenged by well-regarded economists whose econometric analyses show little role for economic inequality causing bad overall health outcomes when other variables are simultaneously considered. Econometric studies on this issue, however, are hindered by the fact that there are many factors directly affecting life expectancy that are connected to inequality. A prime example is smoking. One of the important studies that found no significant role for income inequality in affecting life expectancy did find that “life expectancy for individuals in the lowest income quartile were significantly correlated with health behaviors such as smoking.” Smoking, however, according to a 2016 Centers for Disease Control and Prevention report, is strongly negatively correlated with income. It can be understood in relation to inequality and the stress that inequality generates. But the inequality-to-smoking-to-lower-life-expectancy connection can get obscured in these studies.
Regardless of how one views the causal issue, there is no controversy over the central fact that health outcomes and death rates are strongly connected to the large economic inequality that exists in the United States.
Did you find this article useful? Please consider supporting our work by donating or subscribing.
